In the July 2012 edition of LC-GC Europe, John W. Dolan advises on troubleshooting analytical LC methods when peak shapes have changed since the method was introduced. He also discusses why sometimes a peak can normally deviate from the ideal shape we are familiar with from the catalogues of column suppliers. Sometimes the shape can approach a fairly sharp right triangle.
We discussed triangular peaks in LC-GC International, back in July 1996 (pages 414-427). That isn't a reproach; magazine articles are not usually cited, unless they're your own. Since then, not very much has been written on the subject in the analytical literature, although it is well understood in the field of preparative chromatography.
It wasn't one of John's objectives to discuss one possible reason for misshapen or slightly tailing peaks: the presence of unexpected impurities. There's a catch here that we mentioned in LC-GC Europe in January 2002 (pages 31-41); it's known from preparative chromatography that if the main peak is triangular, an impurity peak can be spread out ("tagged along") beneath it and thus be lost. |  Detecting impurities that coelute with the main peak |
As usual, we're discussing small-molecule compounds that are "nearly" pure, such as drug substances and other fine chemicals. The chromatograms show a main peak that may possibly be off-scale and (often) a certain number of impurity peaks, perhaps several thousand--fold smaller. When the main peak has an unexpected shape, we have to consider, in addition to possible chromatographic anomalies, the possibility that an unexpected impurity is not complete resolved from it. Here, we consider what can happen when, even in the absence of impurities, the main peak doesn't have a shape close to a normal distribution.
We presented examples of fairly sharp right triangular peaks in reversed-phase chromatography (LC-GC International, 1996), and John Dolan presented some more in his July 2012 article. This kind of peak is also familiar in ion chromatography; the situation is not necessarily anomalous, but if we want to be sure of detecting all significant impurities, we need understand something about the possible mechanisms.
We don't need to repeat John Dolan's discussion of defects in the column or other components. Nor does the present discussion concern kinetic causes of peak deformation; we assume that the exchange of the analyte between the mobile and stationary phases is rapid compared to the peak width, and that the retention index is such that each molecule makes very many exchanges before it leaves the column.
Non-linear isotherms
The remaining cause of non-normal peak shapes is that at a given point in the column, the fraction of analyte retained by the stationary phase (a sort of equilibrium constant) depends on the amount or concentration. Various practical ways of obtaining a plot of fraction retained vs concentration in the mobile phase are described in the preparative chromatography literature. The chromatographic process is described as linear if this plot is a straight line through the origin. The plot is usually termed an isotherm, in order to frighten beginners with thermodynamic theory. It is a reminder that temperature may affect both the slope and the shape of the line.
If the isotherm is linear, the peak has the shape of a nearly normal distribution, provided the other conditions above are met. When the isotherm is convex (fraction retained diminishing with increasing amount), the peak tends towards a tailing right triangular shape, as shown in the figure below. When it is concave, one obtains the mirror image, a triangular peak with leading. If the shape of the isotherm has been measured experimentally, the shape of the chromatographic peak can be calculated, and this is done routinely in industrial preparative chromatography.
However, calculations can not explain why the isotherms aren't linear. There is more than one general type of explanation, though we don't always know which one applies in a given case, and may not need to know.
The simplified elementary theory of chromatography assumes that the retention sites on the stationary phase are discrete and all the same, rather like a particular subtype of neurotransmitter receptor in a cell membrane. In practice there may be many different kinds of places at which molecules can become retained, and they don't all have the same affinity. There may be a relatively small number of sites with the highest affinities, so the first analyte molecules to arrive at a point in the column are more strongly retained than the late arrivals.
Another thing that can happen is that analyte retained by the stationary phase modifies its properties, effectively constituting a different stationary phase with different properties. The modification could increase or decrease the affinity. There is also scope for other non-linear mechanisms; John Dolan proposes that positively-charged analyte molecules within the pores of the stationary phase particles could repel further molecules. This can't be the only explanation for triangular peaks, because the two opposite cases we presented in 1996 both involved cationic drug substances.
Non-linear mixed isotherms
Up till now, we have been discussing the "one-component problem" where only one compound is injected. Impurities are often chemically related to the main component. When the latter has a non-linear isotherm we would, therefore, expect its presence on the column to affect the retention of the impurity. This interaction is characterised by mixed or competitive isotherms which, again, are determined when optimising industrial preparative separations.
Non-linear mixed isotherms are associated with a wide variety of peak shapes, and there are books full of them. Two effects are relevant here. The first is chromatographic displacement; the main component displaces an impurity peak to the leading or trailing edge of its peak. This may possibly be one reason why LC columns that give non-linear isotherms have been popular for two decades or so. The effect was described and explained in the biochemical literature well over half a century ago. Sometimes a preparative column was said to be "overloaded"; modern LC columns can become overloaded under analytical conditions.
A second possible consequence of non-linear mixed isotherms is the opposite of displacement: the "tag-along" effect. The impurity peak is stretched out under the main peak. There is no hope of detecting such impurities with non-specific detectors such as UV, and even with LC-API-MS they are likely to be lost in the noise of background and adduct spectral peaks.
We were able to "catch" only one real-life example of these non-linear effects, using particle-beam LC-MS with electron ionisation. As commonly happens there was a combination of displacement and tag-along. It was published in the 2002 article and the chromatogram is shown below.
|
| 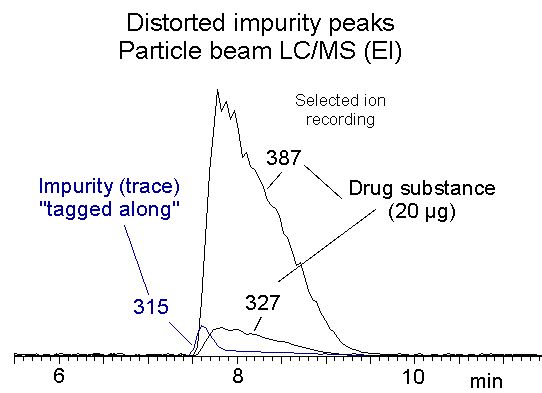 |
The drug substance being investigated gave ions of m/z 387 and 327, and the impurity was selectively detected by the ion of m/z 315. With UV detection (not shown) the impurity peak could not be properly integrated (see below), and it proved difficult to optimise the separation. The MS recording shows why: a significant fraction of the impurity peak is being tagged-along by the main peak, so that the impurity will be underestimated if we rely only on UV detection.
These non-linear effects are observed at column loadings typical of analytical separations (low µg range per gram of packing). It seems rather unlikely that they are due to the presence of a minority of high-affinity sites, because both shapes of isotherm occur, and a notable feature of the columns concerned is their excellent batch-to-batch reproducibility over long periods.
|
| Consequences for analytical development
Some frequently-used columns present a significant risk that impurities will be partially or totally tagged-along by the main analyte. Detection of such impurities is, to say the least, uncertain, even with mass spectrometry. It would be unwise to attempt to integrate an impurity peak that is not completely separated from the main peak.
The optimisation carried out during analytical development is expected to reveal all significant impurities in a product. However, the scope for chromatographic optimisation has been limited by the trend towards "LC-MS friendly" mobile phases; numerous additives, in particular most ion-pairing agents, are now rarely used. The only reliable solution appears to develop at least two methods with different columns to the stage at which they could be validated, whether or not the formal validation is undertaken.
For chromatographers not familiar with the regulatory situation we should explain that there may be, for numerous reasons, some pressure to retain only one chromatographic method in the analytical monograph used for product release. When the main peak does not have a nearly Gaussian shape, early R&D and production batches ought to be examined using an additional method. It could be argued that backup methods should be obligatory, but with some relaxation of the stringent and expensive conditions of current "quality systems", which tend to discourage a precautionary approach.
It could also be argued that a backup separation method should involve only demonstrably linear chromatography, unless it is reasonably "orthogonal". One reason for this proposal is that, if one of the methods has not too much risk of tag-along effects, we can hope to find impurities hiding under the main peak by using column switching techniques. We discussed this subject in the 2002 article and revisit it here. |
| | Column switching in liquid chromatography | ") | The need for progress in chemical and pharmaceutical analysis
Hoping to stimulate development in this area, we presented some very preliminary ideas in our LC-GC article of 2002.
It seems to have been a waste of time, because in the February 2013 issue of The Column (vol 9 issue 3), Incognito rants about a continued lack of general acceptance of LC column switching techniques. Perhaps he/she was asking too much because the client was too stubborn to consider even GC/MS, which many of us had thought of as mainstream for nearly half a century.
Researchers in other fields have been using 2-D liquid chromatography for decades; every peak emerging from the first column is re-chromatographed on another one. Our requirements are much simpler: we need only divert a single narrow fraction to a second column. Equipment for this can be quite straightforward to construct and operate.
Here, we propose an account of some of our earlier work, in the context of the general problem of ensuring that every significant impurity in a compound has been detected.
|
| |
|